| INTERACTIVE MAPPING |
The interactive mapping site for Georia Toronto is designed as a demonstration web site. Some ideas about the potential utility of GIS tools for exploring these kinds of data sets are shown here. The site also demonstrates live serving of web maps from GIS data, and the use of this technology for data publication and dissemination. Not all of the data sets collected for the project are represented in the web maps. For a full current listing of the project data sets see the Database Summary. HOW THE INTERACTIVE MAPPING SITE WORKS
The dropdown menu above indicates the sample data layers that will be available for viewing. The Contents are divided into NATIONAL, REGIONAL, and URBAN scale themes. When the cursor is over one of the main divisions, sub-areas within that scale will "drop down", and sub-themes will "fly out". Clicking
on one of these takes the user to an Interactive Mapping Themes
page.
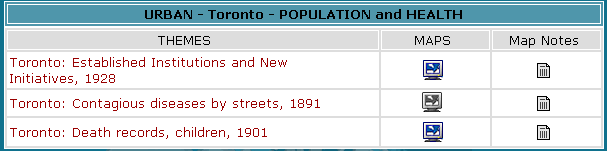
This page lists the Interactive Maps available in this section of the website. Clicking on one of the blue MAPS computer icons will pop-up the selected map in a new browser window. Clicking on the yellow Map Notes icons will bring specific notes and details about that map into the current window. Note: If Pop-up windows have been blocked, please enable pop-ups or map windows will not appear. For
Help on using the Interactive Map
pages and tools, |